Create Alerts
Introduction
Alerts in Motadata
In Motadata we keep the track of each monitor for your network. For every monitor, we have defined some thresholds based on their activity. The thresholds have conditional values that is compared against the activity of the monitor. When monitor’s activity crosses the condition value, Motadata alarms you about it. You can manage these thresholds and the condition values in the Alerts section. An alert contains different thresholds to notify you about the different level of activities of a monitor. Each threshold has one condition and many actions against associated with it. For example: In a warning threshold, you have set a condition that when a CPU process is more than 30%, a GUI notification should show as an action.
What Alert Screen Offers
The alerts menu is dedicated to create and manage alerts. By default, Motadata gives you the pre-defined alerts for all monitor types. You can use the alerts as they are or you can modify them. If you want an alert but you don’t see it in the list, you can create a new alert. Motadata uses these alerts to identify the states of monitors. All other menus in Motadata uses the results of these alerts and shows you the data.
Alerts menu have 3 sections for: monitors, flow/logs and traps respectively. The menu is divided in these sections for two reasons: 1) You can find the alert easily. 2) While creating the alert, all the options and fields are alert specific only. For example: flow alert page will show only flow alerts. When you are creating a flow alert, Motadata will show only flow related fields.
Segment of Alerts
Monitor Alerts: Monitors are the entities that has an IP address. The page enlists all the alerts available for the monitors.
Flow/Log Alerts: Flow and logs are the messages that are generated due to network activity. The page enlists all the alerts available for the monitors.
Trap Alerts: Trap is the information that tells about change in network settings. The page enlists all the alerts available for the monitors.
Alert Flow Process
When you create an alert in Motadata, it uses following process:
An alert is active for the monitors selected from the filter conditions.
Motadata reads the monitor’s metric value at every poll.
It compares the metric value with the thresholds of the alert.
When the monitor’s metric matches with the threshold condition, Motadata executes the action associated with the threshold value.
Create Alerts
Before You Start
Alerts are created on a source type. All the monitors with that source type automatically falls into that alert.
You can create only 1 alert for one metric of a monitor.
If you want a different alert for same metric of specific monitors (other than what you are creating for the source type), exclude them from the alert.
If you want to create an alert for same metric of specific monitors with different conditions (that you excluded while creating the source type), include them in the alert.
Configure Alerts
To create an alert, go to Alerts > Monitor Alerts.
Click on the
Newbutton
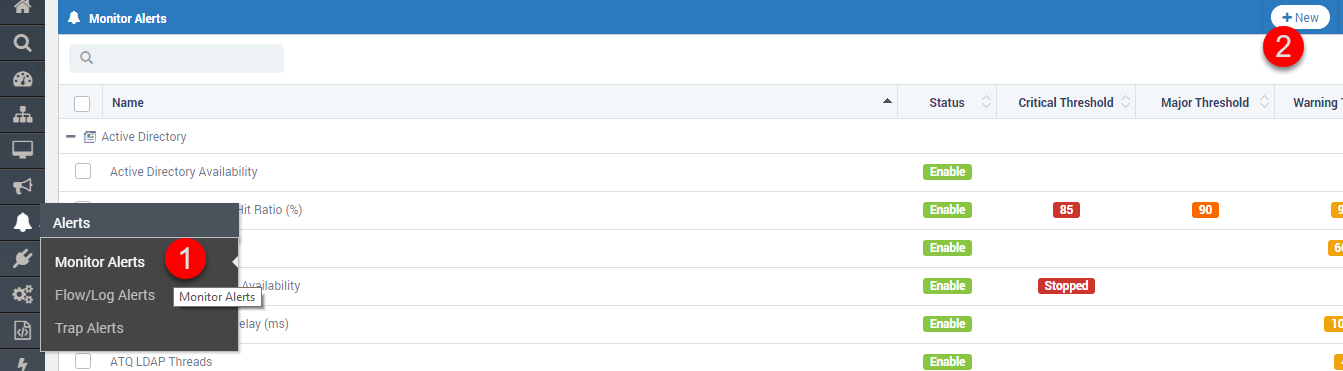
Go to Alerts
Basic Details
On the ‘Create Monitor Alert’ page, type the name of the alert.
- Select the alert status:
Enabled: Keep the alert in enabled mode. Motadata will evaluate the alert for actions in monitor’s status.
Disabled: Keep the alert in disabled mode. Motadata will not evaluate the alert.
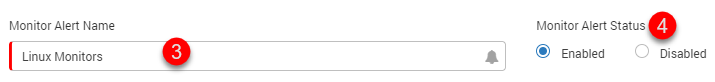
Alert Name and Alert Status
Example:
Monitor Alert Name: Linux Monitors
Monitor Alert Status: Enabled
Filter Conditions
Filter conditions basically asks you following questions:
What type of monitors you want to consider?
Where should Motadata search/look for those monitors?
Once the monitors are found, do you want to create alert for specific monitors?
Do you want to keep specific monitors out of the alert?
Select the filter conditions using the 4 options:

Provide Filter Conditions
Source Type
Select the type of the monitor for which you want to create an alert. Based on the source type, the other options MAY change. For example:
The drop-down values of Metric are dependent on the source type.
When a source type is ‘Linux’, another option: ‘Instance Filter’ becomes visible.
Example: Select - ‘Linux’, Motadata will apply alert only on Linux monitors.
Filter
Filter decides how Motadata will identify the monitors of your selected source type. You can choose one of the four methods:
Tag - Use the monitor tags to find a monitor.
Monitor - Use the IP address to find a monitor.
RPE - Look for monitors polled by an RPE.
Department - Look for monitors of a given department.
Example: Select - tag. Motadata will identify all the Linux monitors using their Tags.
Includes
Includes decide which monitors to choose for the alert from the identified monitors. The ‘includes’ dropdown is a dependent of filter dropdown. Hence, you can include monitors like:
Tags: When you select filter as a tag, the list shows all the tags available for that source type. Motadata will choose all the monitors of the selected tags for the alert.
Monitor: When you select filter as a monitor, the list shows IP address/monitor names available for that source type. Motadata will choose all the selected monitors for the alert.
RPE: When you select filter as a RPE, the list shows all the RPEs that are polling monitors for that source type. Motadata will choose all the monitors getting polled from the selected RPE for the alert.
Department: When you select filter as a department, the list shows all the Departments that are linked to the monitors for that source type. Motadata will choose all the monitors associated with the selected departments for the alert.
Blank: When you select nothing in the include dropdown (leaving it blank), Motadata will choose all the monitors for that source type.
Example: Select - ‘Linux’. Motadata will include all the monitors with Linux tag for evaluating the alert.
Excludes
‘Excludes’ decide which monitors NOT to choose for the alert from the identified monitors. Similar to the ‘Include’ dropdown, the value in this dropdown is dependent on the filter. Hence, you can exclude monitors like:
Tags: When you select filter as a tag, the list shows all the tags available for that source type. Motadata will NOT choose any of the monitors of the selected tags for the alert.
Monitor: When you select filter as a monitor, the list shows IP address/monitor names available for that source type. Motadata will NOT choose any of the selected monitors for the alert.
RPE: When you select filter as a RPE, the list shows all the RPEs that are polling monitors for that source type. Motadata will NOT choose any of the monitors getting polled from the selected RPE for the alert.
Department: When you select filter as a department, the list shows all the Departments that are linked to the monitors for that source type. Motadata will NOT choose any of the monitors associated with the selected departments for the alert.
Blank: When you select nothing in the exclude dropdown (leaving it blank), Motadata will NOT exclude any monitor for that source type.
Example: When you leave it blank, Motadata will not exclude any monitor (found by the tags) while evaluating the alert.
Metric
Motadata uses a metric parameter to evaluate the condition of the filtered monitor. At every poll Motadata reads the metric of the monitors and compares with the alert thresholds. There are two types of metric:
Singular Metric: These metrics are system level metric and one value exists for one monitor. For example: CPU (%), the monitor’s CPU utilization percentage.
Interface Metric: These metrics are at instance levels and multiple values can exist for each instance. For example: ‘Disk Volume Utilization (%)’, a hard disk can have many partitions and each partition will have some volume utilized.
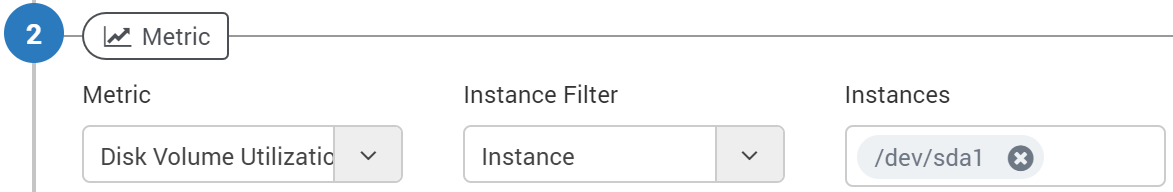
Select Metric Conditions
Metric
Select the metric from the dropdown. If the metric is an interface type metric, you’ll see Instance Filter and Instances.
Example: Select a metric - “Disk I/O Time (%)”. Motadata will evaluate the value of disk input/output time (%) with the alert conditions to find the status of the monitor.
Instance Filter
Instance filter and instances dropdowns are visible when the metric is an interface type. This means we have to give additional details about where to fetch the metric value. Instance Filter has two values to select from: instance or monitor.
Instance: When you select the instance, the instances dropdown shows the list of the monitor interfaces. When you select instance, Motadata will choose the instance of all the monitors.
Monitor: When you select the monitor, the instances dropdown shows the list of monitors. When you select monitor, Motadata will choose the instance of specific monitor.
Example: Select the instance filter - Monitor. Motadata will look into all the instance types of Disk I/O Time (%) of the monitors.
Instances
Instances is the list of the interfaces or monitors (depends on Instance Filter). Motadata considers the values of the instances when evaluating the monitors for the alert condition.
- Choose Specific Instance: To select any specific instance, select a value from the dropdown.
Instance: Motadata evaluates the selected instance of all the filtered monitors.
Monitor: Motadata evaluates only the selected instance of the selected monitor.
Blank: Motadata evaluates all the instances available for the metric.
Example: Select - 172.16.10.101-sda. Motadata will look only into 172.16.10.101 monitor and use the value of its SDA instance in Disk I/O Time (%) metric.
Threshold
Motadata compares the monitor’s metric value with the threshold to determine the condition of the monitor. You can define up to 5 different thresholds for a metric value. For the sake of simplicity and uniformity, we have classified these threshold in some generic labels.
Warning: Set a threshold for the warning level of alert. This can be an early indicator and can help avoid any upcoming vulnerabilities.
Major: Set a threshold for the major level of the alert. This level of alert may require someone’s attention to identify the issue.
Critical: Set a threshold for the critical level of the alert. This level of alert may require immediate action to prevent any vulnerability.
Unreachable: Set a threshold for the unreachable state of the monitor. This level of alert means monitor is vulnerable and needs to be fixed.
None: Set a threshold for the ‘none’ state of the monitor. This level of alert generally means that monitor is in NO alert state.
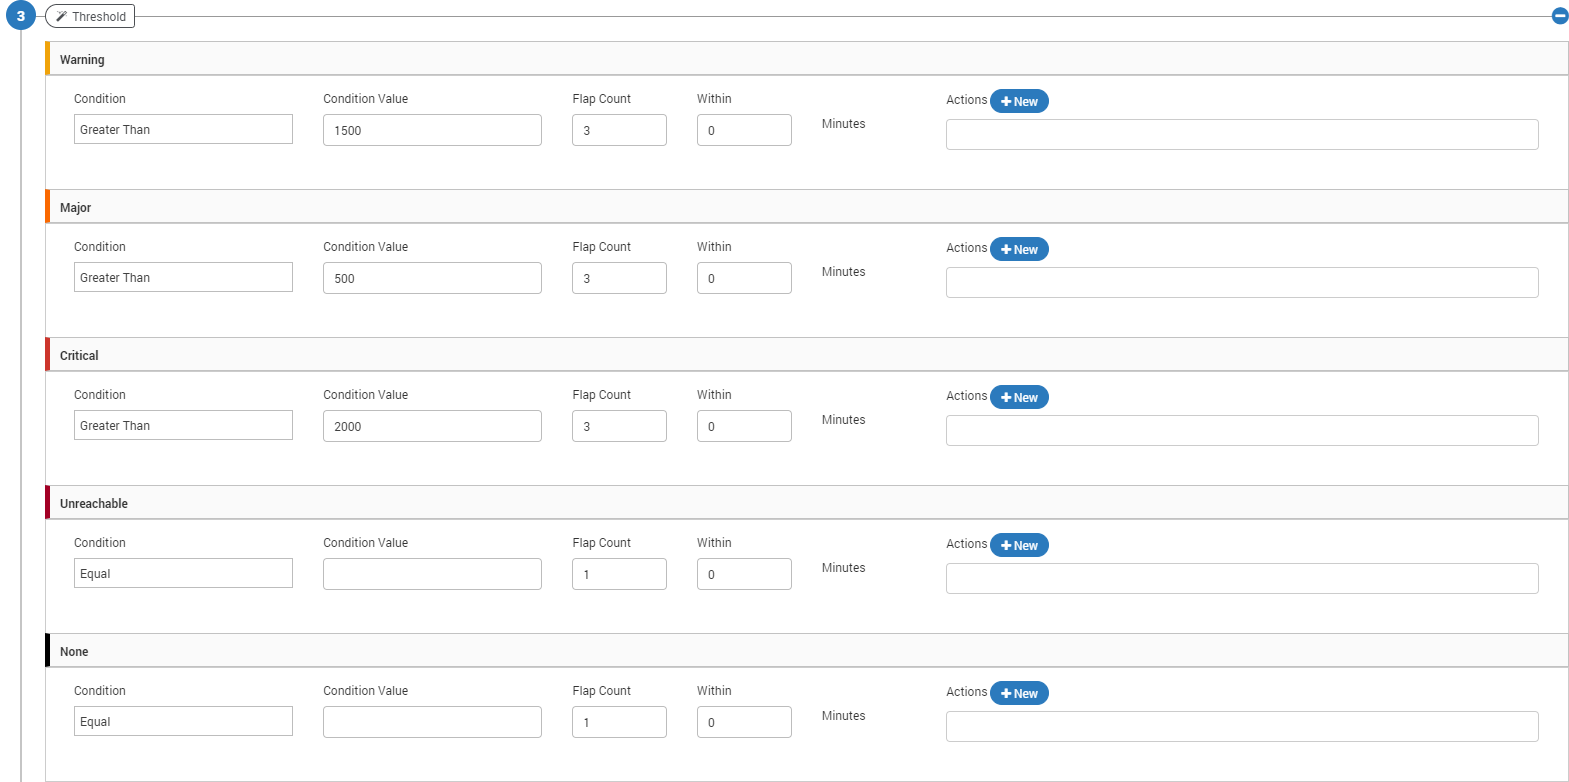
Select Threshold
Threshold Process
Using the parameters of the threshold, Motadata decides if the Monitor is in alert state or not. A threshold contains both: evaluation parameters and actions.
Evaluation Parameters:
Condition: It defines how Motadata will compare the threshold value with the metric value.
** Condition Value:** It is the threshold value that is compared with the metric.
Flat Count: It defines how many times the metric should be compared with condition value before saying monitor is in alert state.
Within: It defines the minute duration under which the metric should match with condition value for specific number of times before saying monitor is in alert state.
Actions: It defines the action that Motadata will take when monitor is found in alert state.
Condition
Select a condition from the given values. The conditions are:
Available for All Metrics +——————————————+——————————————————————-+ | Condition | Description | +——————————————+——————————————————————-+ | Equal | The metric is equal to the condition value. | +——————————————+——————————————————————-+ | Not Equal | The metric is not equal to the condition value. | +——————————————+——————————————————————-+ | Greater Than | The metric is greater than the condition value | +——————————————+——————————————————————-+ | Greater Than or Equal | The metric is either greater than or equal to the condition value | +——————————————+——————————————————————-+ | Less Than | The metric is less than the condition value | +——————————————+——————————————————————-+ | Less Than or Equal | The metric is either less than or equal to the condition value | +——————————————+——————————————————————-+
Available for String Type Metrics Only
Contain |
The metric contains the condition value keyword |
Not Contain |
The metric does not contain condition value keyword |
Start With |
The metric starts with the condition value keyword |
End With |
The metric ends with the condition value keyword |
IN |
|
Not IN |
Example: Select - Greater Than or Equal. Motadata will generate an alert when the value of Disk I/O (%) for SDA in 172.16.10.101 is greater than or equal to the condition value.
Condition Value
Type the condition value in the given box. The metric of the monitor is evaluated against the condition value to determine the state of the monitor.
For example: Select - 75%. Motadata will generate an alert when disk I/O (%) is greater or equal to 75% for SDA in 172.16.10.101.
Flap Count
Flap count is the number of times the metric value is compared against the condition value to decide the status of the monitor.
For example: Select - 3. Motadata will generate an alert when disk I/O (%) is greater or equal to 75% for SDA in 172.16.10.101 at least 3 times.
Within (Minutes)
It is the time duration during which the metric of monitor should match the condition and value a specific number of times (flap count) to decide monitor’s status.
For example: Select - 60. Motadata will generate an alert when disk I/O (%) is greater or equal to 75% for SDA in 172.16.10.101 at least 3 times in 60 minutes.
Actions
When a monitor is found in the alert state, Motadata executes some actions to notify the users. You can select the actions from the available list. If you can’t find the available action, read How to Configure Actions.
Example: Select an email action. Motadata will email the concerned person about the alert.
Note: Select appropriate action for the monitor alert. For example, it makes no sense to use ‘Linux Top N Processes (CPU)’ action with ‘Windows’ monitors.
Alert
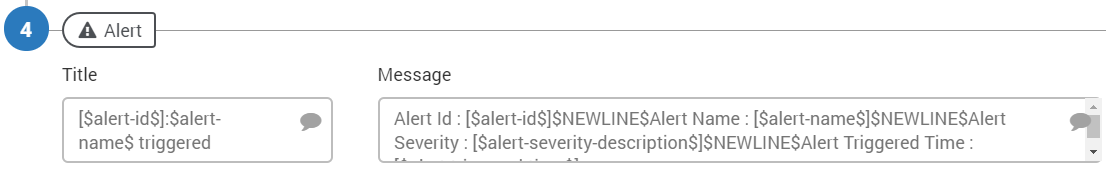
Define Alert Message
The alert sent by Motadata as an email can be configured to use the dynamic values that contains actual value from the alert. With alert values you can send an alert specific message instead of the static generic message. Hence, you can configure the email subject and email body of the alert.
Available Placeholders
$source_host$: Shows the host name of the alert source.
$NEWLINE$: Starts the message into new line. This is for line break.
$ip$: Shows the IP address of the monitor.
$monitor-name$: Shows the name of the monitor.
$alert-id$: Shows the unique alert ID value.
$alert-name$: Shows the name of the alert.
$alert-severity-description$: Shows the severity of the alert.
$alert-severity-id$: Shows the unique severity ID of the alert.
$alert-triggered-time$: Shows when the alert was triggered.
$Status$: Shows the status of the alert.
$monitor-host$: Shows the host name of the monitor.
Title
Title is the email subject ticket title. Leave it blank to use default title.
Message
Message is the subject body of the email. Leave it blank to use default body format.
Appendix
Customize the Alert Characteristics
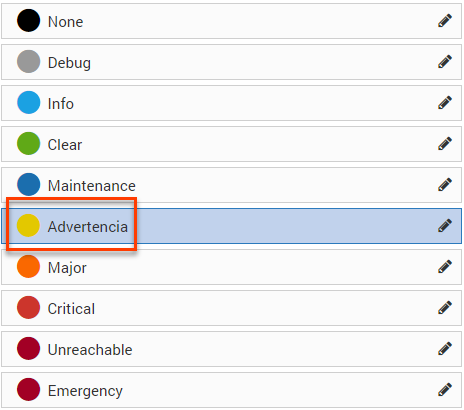
Motadata has used some generic names to identify the level of alerts. You can use your admin rights to change the alert name and its color code. To change the name:
Go to the Admin > Severities.
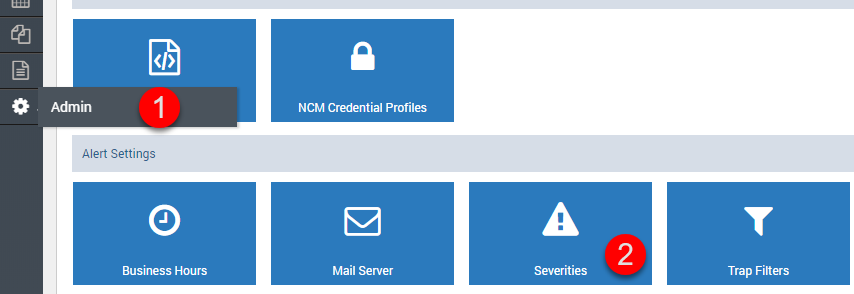
Customize Severities in Admin Section
Edit the severity name you want to change.
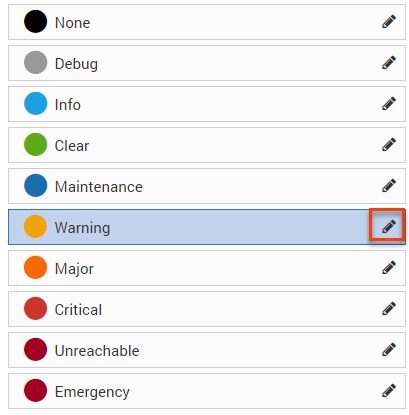
Edit Severity
Type a new name. Select a severity color to change the color.
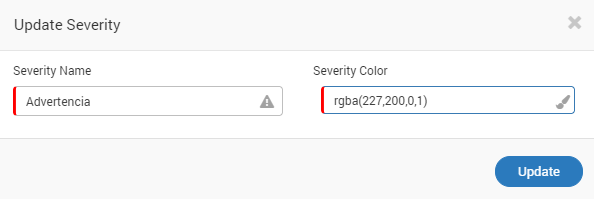
Update Severity Value
Click save.
Changed Severity Value